

You locked in your ocean freight at a good rate. Smart move.
But your cargo journey isn't over. In fact, some of the most expensive surprises often happen after your container arrives at a US port.
Here's what most importers don't realize:
Port performance isn't a single number you can Google.
Search "port congestion," and you'll see conflicting headlines:
- One source claims Los Angeles is flowing smoothly.
- Another reports multi-day vessel wait times in Savannah.
- A third highlights extended rail transfer delays in Long Beach.
They're all correct, and all incomplete.
Port performance is a multi-layered system, and understanding how to read the signals is what separates importers who navigate disruptions smoothly from those who get hit with surprise demurrage, detention, and chassis fees.
Why Port Performance Data Is So Confusing
1. The Numbers Keep Changing (And That's Normal)
Dwell time isn't a static figure. It changes by:
- Terminal
- Carrier
- Cargo type (truck vs. rail)
- Time of day
- Week of the month
- Season
- Volume surges
A chart showing "3.5-day dwell" might only apply to a specific terminal during a specific week. This variability isn't an error. It's reality.
2. "Dwell Time" Isn't One Thing
Dwell time is actually four different clocks:
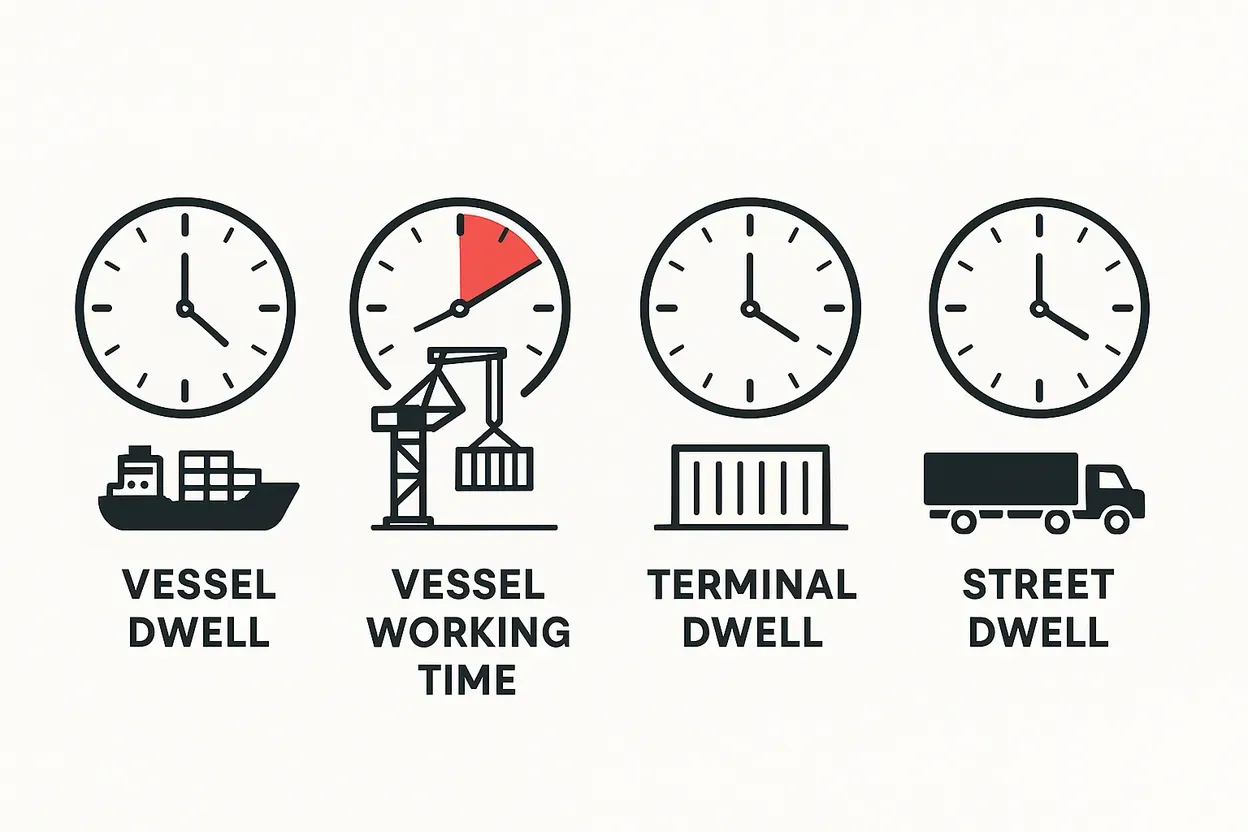
- Vessel dwell: anchorage to berth
- Vessel working time: berth to discharge
- Terminal dwell: discharge to gate-out
- Street dwell: chassis out to chassis return
So when someone says:
"The port dwell time is 5 days."
Your first question should be: "Which dwell?"
A 2-day vessel delay + a 3-day terminal dwell + a 5-day street dwell = 10+ days added to your supply chain, none of which is reflected in a single headline.
3. Carriers and Terminals Perform Very Differently
Two vessels arriving at the same port this week may have completely different outcomes depending on:
- Berthing priority
- Labor allocation
- Yard space
- Railcar availability
- Chassis pool health
- Discharge efficiency
In 2025, major carriers at US East Coast ports reported zero wait time on some rotations and extended delays on others during the same period.
Your cargo doesn't go through "the port."
It goes through your terminal, on your carrier, during your time window.
4. Port Data Doesn't Reflect Your Actual Shipment Path
A port authority may report "smooth operations," yet your shipment can still be stuck because:
- Your drayage carrier couldn't secure an appointment
- Your terminal's chassis pool was depleted
- Your warehouse couldn't receive
- Your customs docs weren't cleared
- Your cargo was rail-destined during a surge
This is the key concept most importers miss:
Port data = macro.
Your container = micro.
This gap is where surprises, and costs, happen.
This is why your experience can contradict the news.
The Cost Cascade Most Importers Miss
Terminal delays aren't just inconvenient. They're expensive.
- Days 1–5: free time (varies by carrier/terminal)
- Days 6–10: $75–150 per day (demurrage)
- Days 11+: $150–300 per day (higher-tier demurrage)
- Chassis detention: $200–400+ if you miss the return window
- Warehouse delays: can trigger both demurrage and chassis detention
These fees stack, and they compound across multiple shipments.
A single operational delay can quietly add hundreds to thousands to your landed cost.
The Three Port Signals Importers Should Actually Track
Importers don't need to chase every metric.
What they need is to track the trend, not the number.
Here are the three indicators that matter most:
1. Terminal Dwell Trend (Not Precision KPIs)
Instead of asking:
"What is the dwell time today?"
Ask:
"Is terminal dwell trending up or down compared to last week?"
Why this works:
- Rising dwell = tightening capacity
- Falling dwell = improving flow
- Stable dwell = predictability
Even a shift from 2.5 to 3.8 days can affect appointment availability, chassis supply, and cost exposure.
Trend > point-in-time number.
2. Chassis Velocity (The Hidden Congestion Indicator)
Chassis problems are circulation problems, not inventory problems.
Chassis velocity slows when:
- Warehouses take longer to unload
- Containers sit over weekends
- Vessel bunching floods terminals
- Rail ramps face volume spikes
- Street dwell increases
Even a small increase in dwell time can have a compounding effect, because extended idle time removes a substantial portion of the chassis fleet from active service.
When chassis stop moving, containers stop moving.
3. Appointment Tightness & Drayage Lead Times
You can have:
- A discharged container
- Customs cleared
- A chassis available
…and still face a multi-day delay if appointment windows tighten.
Appointment availability reflects:
- Terminal labor
- Yard density
- Gate throughput
- Weather
- Vessel bunching
- Regional trucking supply
For many importers, appointment tightness is the real choke point, not the port itself.
What Importers Can Control (And What They Can't)
You cannot control:
- Terminal labor shortages
- Vessel arrival bunching
- Chassis imbalance
- Rail network delays
- Port-side yard density
But you can control the highest-impact levers that reduce surprise costs.
The Importer's Playbook
1. Pre-clear customs 5–7 days before arrival
This eliminates avoidable terminal dwell, especially during peak arrivals. Your customs broker can file the entry before the vessel arrives.
2. Book drayage earlier than your typical window
Don't wait for availability notices.
Plan drayage before the vessel arrives.
3. Confirm warehouse receiving hours & staffing
A warehouse delay leads to chassis detention, which is unnecessary cost.
4. Know your free-time rules by carrier & terminal
Free time can vary significantly, even within the same port. Track your last free day for every container.
5. Track weekly signals, not daily headlines
Monitor:
- Dwell trend direction
- Appointment availability
- Chassis circulation
- Drayage lead times
This gives you actionable insight, not noise.
Quick Cost Reality Check
A small delay can add up fast:
- 3 days at terminal: $225–450 demurrage
- 5 days chassis detention: $300–400+
- 1 missed warehouse window: schedule delays + unnecessary fees
These aren't hypotheticals. They're Tuesday.
Next Steps: Your Action Framework
- Audit your last 5 shipments.
Compare expected vs. actual dwell + chassis time. - Ask your forwarder each week:
"What's the terminal dwell trend: rising, falling, or flat?" - Make pre-arrival customs clearance standard practice.
Not optional. - Build a drayage + warehouse coordination SOP.
The fewer moving parts, the fewer surprises.
Final Word
Port performance is not one number. It's a system of signals.
When importers stop chasing exact dwell statistics and start interpreting trends, they make smarter routing decisions, avoid surprise fees, and protect their landed cost.
Better decisions don't come from perfect data.
They come from knowing how to read imperfect data correctly.
Get a quote for your shipment
Have a shipment to move? Send the origin, destination, cargo, and container size or weight. We reply with the rate, the routing and the services included.
