


Update, September 27, 2026: The reliability figures below describe late 2025 and early 2026. Sea-Intelligence measured global schedule reliability at 62.4% in January 2026 and 56.4% in July 2026, the year’s low so far, while Gemini still led the alliances in the first half of the year. Current sailings and service changes by lane are on Sealanes.
For most of 2021–2023, volatility masked everything.
Schedules collapsed.
Transit times stretched unpredictably.
Buffers kept expanding.
If cargo was late, it was “the market.”
If inventory was high, it was “risk management.”
If detention spiked, it was “capacity constraints.”
Now the disorder has eased.
But that does not mean reliability has returned to normal.
Where Reliability Actually Stands
At the start of 2026, global schedule reliability was hovering between 55–65%.
That’s a material improvement from the 30–40% lows of peak disruption.
But it is still far below the 70–80% consistency importers were accustomed to pre-pandemic.
The Red Sea remains structurally unstable.
Cape of Good Hope routings continue to extend transits.
Weather and port rotations introduce variability on longer loops.
This isn’t chaos anymore.
It’s structural inconsistency.
And that difference matters.
The Carrier Divide Is Now Real
The market is no longer uniform.
Some networks are materially outperforming others.
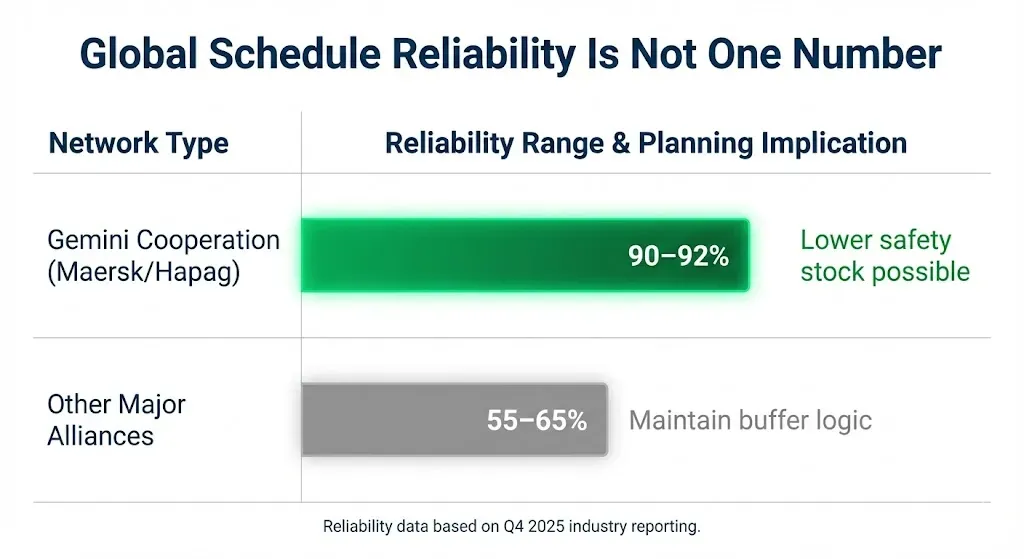
The Gemini Cooperation (Maersk + Hapag-Lloyd), for example, delivered ~90% schedule reliability on key trades in late 2025.
Other major alliances sat in the 55–65% range.
That spread is no longer marginal.
It is operationally decisive.
Treating a 90% reliable loop and a 60% reliable loop with identical inventory buffers is now a mathematical error.
Carrier choice now dictates inventory capital.
That is new.
The New Risk Isn’t Chaos. It’s Process Lag.
When reliability was 30%, buffers were survival.
At 60%, buffers can become waste.
Not because the market is perfect —
but because internal systems are still built for 2022.
If vessel ETAs are stabilizing but:
Drayage booking is still reactive
Warehouse labor is scheduled against padded expectations
Chassis allocation assumes delay
Purchase orders carry blanket safety stock
Then the cost doesn’t disappear.
It shifts.
From upstream disruption to downstream inefficiency.
A Subtle Example
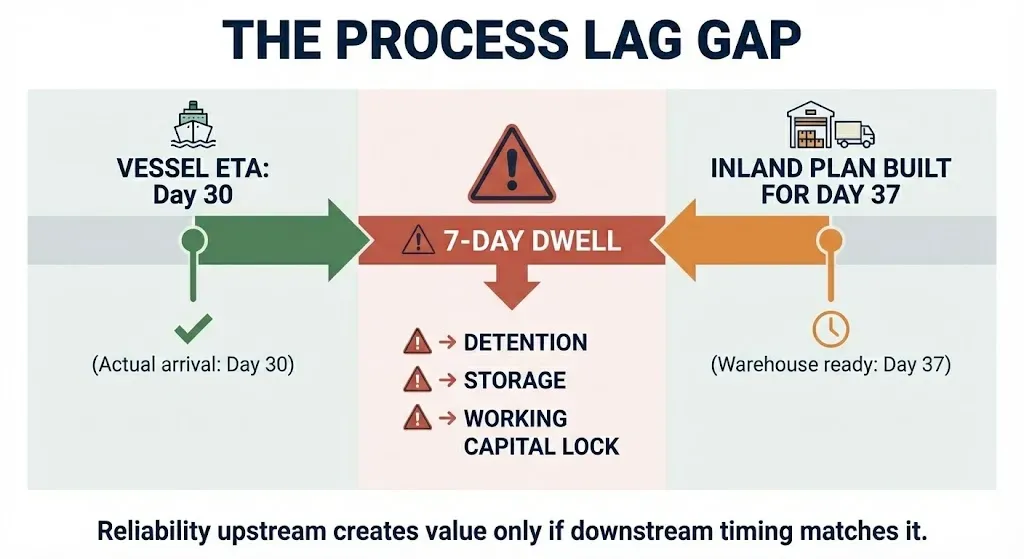
Imagine a shipment moving on a 90% reliable loop.
The vessel arrives within its window.
But your inland plan still assumes a seven-day variance buffer — a habit built during peak volatility.
Drayage is booked conservatively.
Warehouse receiving isn’t ready.
The container sits.
Detention accrues.
Nothing “failed.”
But alignment didn’t happen.
That's a process lag.
And in a 60% reliable world, it’s expensive.
Volatility Has Changed Shape
The volatility of 2022 was operational chaos.
The volatility of 2026 is structural constraint.
That means the response must change.
This is not the moment to slash safety stock blindly.
It is the moment to segment intelligently.
High-reliability carrier networks → reduce buffers methodically
Mid-range networks → maintain discipline
High-variance lanes → keep defensive inventory
Uniform policy no longer works.
Granular policy does.
What Importers Should Audit Now
Lane-Level Reliability
Stop using global averages.
Track your actual carrier performance by trade. Our transit time tool is a starting point for comparing carriers on a lane.Arrival-to-Gate Timing
Has dwell increased even as vessel reliability improved? (For reading port dwell data, see Port Performance Isn’t One Number.)Inventory Segmentation
Does your safety stock logic reflect carrier performance differences?Booking Logic
Are drayage and chassis decisions built on live ETAs — or historical fear?
The market is no longer extreme. Which means inefficiency is no longer hidden.
The Bottom Line
Reliability hasn’t returned to pre-pandemic levels.
But it has stabilized enough to expose misalignment.
The next cost wave will not come from rate spikes.
It will come from slow internal adaptation.
Volatility masked inefficiency.
Stabilization reveals it.
And in 2026, competitive advantage belongs to the teams who adjust internal discipline faster than the market shifts.
Get a quote for your shipment
Have a shipment to move? Send the origin, destination, cargo, and container size or weight. We reply with the rate, the routing and the services included.
